
Kubernetes for Scalable Microservice Deployment
Kubernetes for Scalable Microservice Deployment
Executive Summary
Kubernetes has emerged as the de facto container orchestration platform for deploying scalable microservices at enterprise scale[1]. This article explores proven architectural patterns and best practices for building resilient, cost-efficient microservice deployments on Kubernetes.
Surveys show 70%+ enterprises leverage Kubernetes for production workloads[2]. This comprehensive guide provides senior engineers and architects actionable insights into designing scalable microservice architectures with zero-downtime deployments, automatic scaling, and comprehensive observability.
The transition from traditional monolithic architectures to cloud-native microservices represents one of the most significant architectural shifts in software engineering. Organizations embracing this transformation achieve unprecedented agility, reliability, and cost efficiency[3].
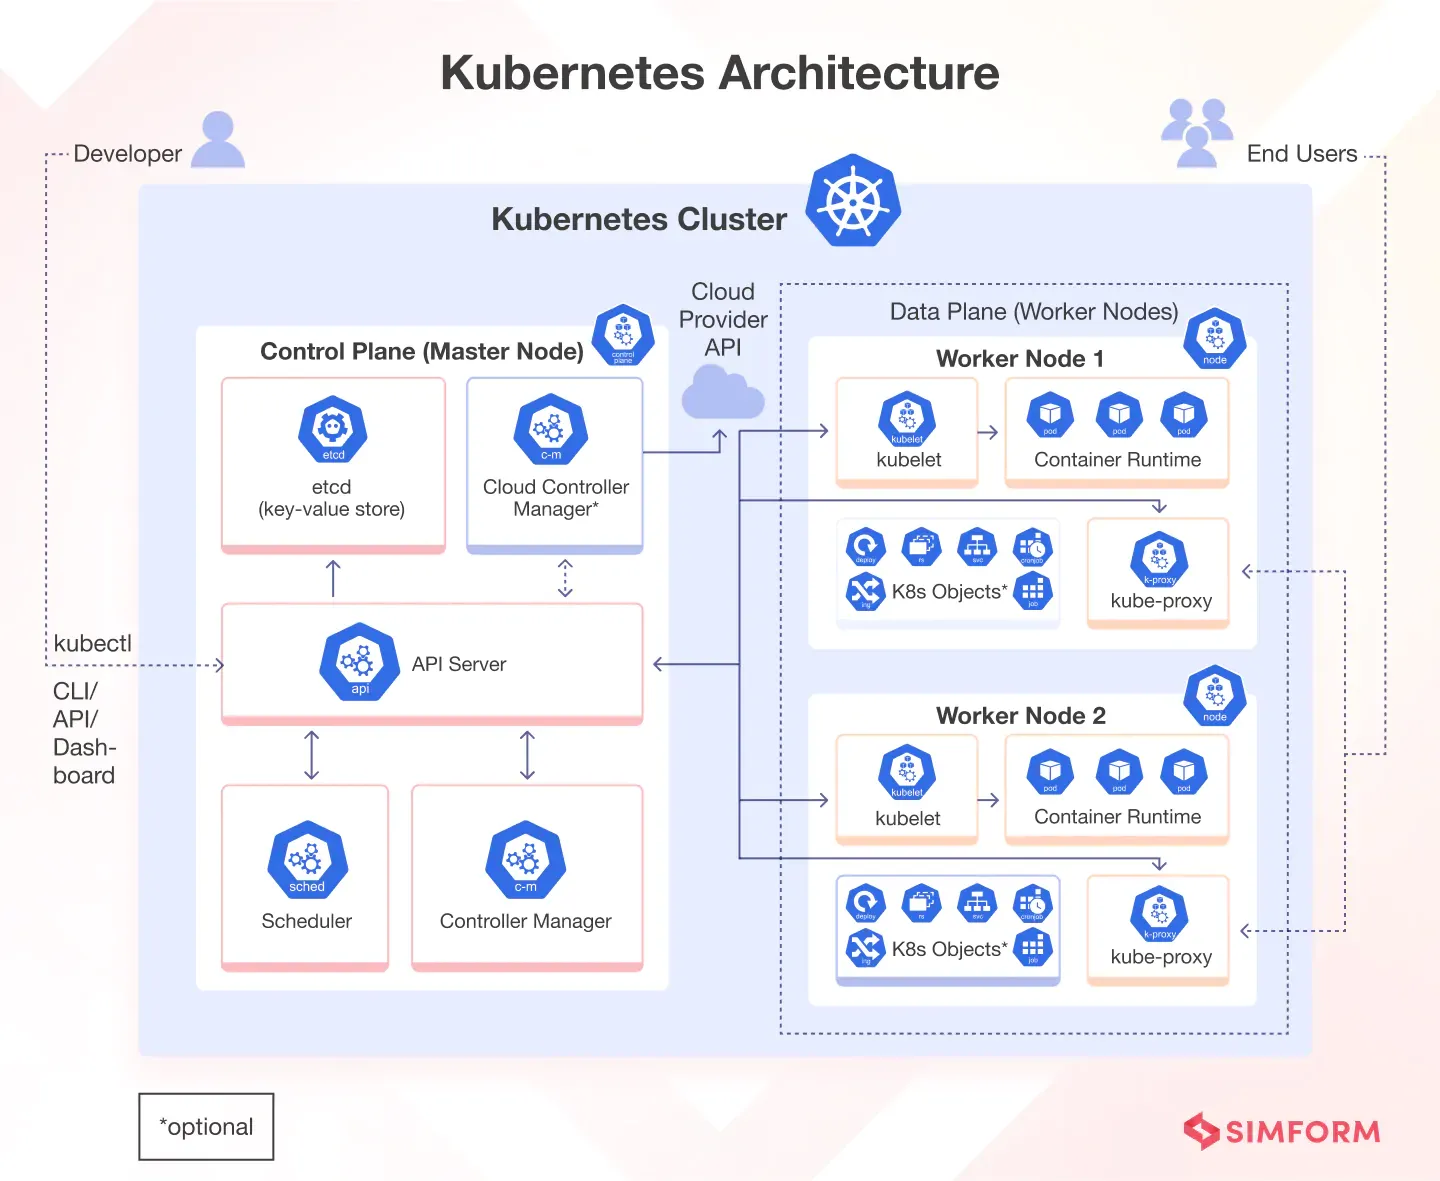
Figure 1: Kubernetes Architecture Overview - Control Plane and Worker Nodes
1. The Evolution from Monoliths to Microservices
1.1 Understanding Monolithic Architecture
Traditional monolithic applications represent a single, tightly-coupled codebase deployed as a unified artifact. While suitable for startup-phase applications, monoliths present significant challenges as systems scale[3]:
Key Limitations of Monolithic Architecture:
-
Single Point of Failure: Critical bugs in any component crash the entire application, resulting in total service disruption
-
Technology Lock-in: Entire system must use consistent technology stacks and frameworks across all components
-
Deployment Friction: Even minor updates require redeploying the entire massive codebase
-
Limited Scalability: Scaling one feature requires scaling the entire monolith, wasting computational resources
-
Development Bottlenecks: Large teams struggle with coordination due to high coupling between components
-
Slow Release Cycles: Coordinating changes across teams becomes increasingly complex
Consider a typical enterprise e-commerce application with authentication, payment processing, inventory management, and reporting modules all embedded within a single WAR file. When inventory management experiences a memory leak, the entire platform—including the revenue-generating payment processor—crashes, resulting in direct financial loss[4].
1.2 The Microservices Paradigm Shift
Microservices architecture decomposes applications into small, independently deployable, loosely-coupled services communicating via standardized protocols (HTTP/REST, gRPC, message queues). This architectural pattern addresses monolith limitations through fundamental design principles[3][4]:
Core Microservices Principles:
-
Service Independence: Each microservice owns its database, codebase, and complete deployment lifecycle without dependencies
-
Fault Isolation: Failures are contained to specific services, preventing cascade failures across the platform
-
Independent Scaling: Services scale independently based on actual demand patterns for that specific function
-
Technology Heterogeneity: Different teams can choose optimal technology stacks for their specific service requirements
-
Autonomous Delivery: Services can deploy independently without coordinating with other teams or services
-
Organizational Alignment: Service boundaries align with team structures and organizational hierarchies
Breaking down our earlier example of Enterprise eCommerce Application: the Payment Service, Inventory Service, Authentication Service, and Reporting Service become independently deployable units. When inventory experiences issues, payment processing continues uninterrupted, protecting revenue streams and customer experience[5].
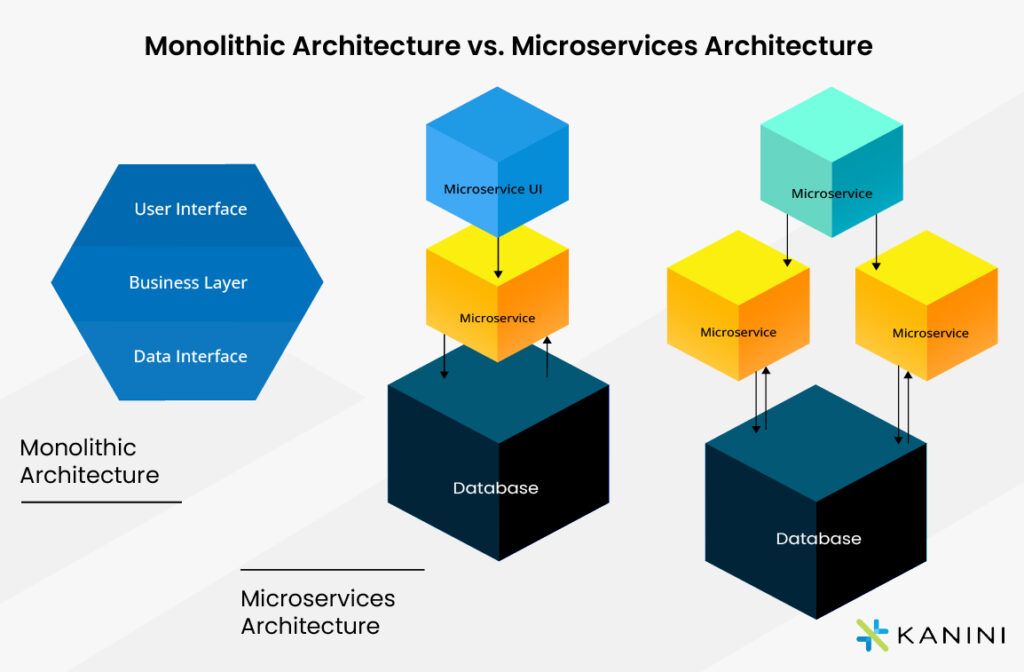
Figure 2: Monolithic vs Microservices Architecture - Organizational and Technical Comparison
1.3 Why Kubernetes for Microservices?
While Docker enables application portability, Kubernetes solves the orchestration challenge at scale. Managing hundreds of containers across dozens of servers manually becomes impossible; Kubernetes automates this complexity[2]:
-
Automated Deployment: Define desired state declaratively; Kubernetes continuously maintains it
-
Self-Healing: Automatically restarts failed containers and reschedules failed pods across healthy nodes
-
Horizontal Scaling: Automatically adjusts capacity based on real-time metrics and application demand
-
Rolling Updates: Deploy new versions with zero downtime through gradual pod replacement
-
Service Discovery: Automatic DNS and load balancing enabling dynamic service-to-service communication
-
Resource Management: Efficient bin-packing and resource utilization across entire cluster
-
Multi-Tenancy: Namespace isolation enables multiple teams sharing infrastructure safely
Kubernetes abstracts underlying infrastructure complexity, enabling teams to focus on application logic rather than infrastructure management[1].
2. Kubernetes Architecture Fundamentals
2.1 Core Components and Topology
A Kubernetes cluster consists of control plane components orchestrating worker nodes. The control plane maintains cluster state and makes global decisions[1]:
Control Plane Components:
-
API Server: Central communication hub handling all Kubernetes REST API requests and cluster communication
-
etcd: Distributed key-value store maintaining complete cluster state and configuration
-
Scheduler: Intelligently assigns pods to worker nodes based on resource requirements and constraints
-
Controller Manager: Runs multiple controllers managing cluster state (Deployment, StatefulSet, Job controllers)
-
Cloud Controller Manager: Bridges Kubernetes with cloud provider APIs for load balancers and storage
Worker Node Components:
-
Kubelet: Agent ensuring containers run in pods exactly as specified by control plane directives
-
Container Runtime: Docker, containerd, or CRI-O executing actual container instances
-
kube-proxy: Maintains network rules enabling service discovery and load balancing between pods
2.2 Key Kubernetes Concepts
Pods: The smallest deployable units in Kubernetes, typically containing a single container but capable of hosting multiple tightly-coupled containers sharing network namespace, IP address, and storage volumes.
Services: Abstract layer providing stable IP addresses and DNS names for pod groups. Services decouple service consumers from ephemeral pod instances, enabling reliable service discovery as pods scale up and down.
Deployments: Higher-level abstractions managing replica sets. Deployments ensure desired pod count, automate rolling updates, enable version control, and provide rollback capabilities.
StatefulSets: Specialized deployments for applications requiring stable identity and persistent storage (databases, message queues). Each replica has stable hostname and persistent volume.
Ingress: API object managing external HTTP/HTTPS access to cluster services. Ingress controllers handle routing, TLS termination, and load balancing for external traffic.
ConfigMaps and Secrets: Kubernetes objects storing configuration data and sensitive information separately from container images, enabling environment-specific deployments.
3. Microservice Architecture on Kubernetes
3.1 Traffic Flow and Service Discovery Architecture
Modern microservice applications on Kubernetes follow a layered request flow design:
External Client → LoadBalancer → Ingress Controller → Kubernetes Service → Pod Replicas → Backend Database
Ingress Controller manages external HTTP/HTTPS traffic routing based on hostnames and URL paths, eliminating individual LoadBalancer services per microservice. This centralization reduces cloud infrastructure costs significantly[2].
Service Discovery: Kubernetes Services provide automatic DNS resolution without hardcoding IP addresses. Service A discovers Service B via deterministic DNS: service-b.namespace.svc.cluster.local. This automatic discovery adapts instantly as underlying pods scale up or down[4].
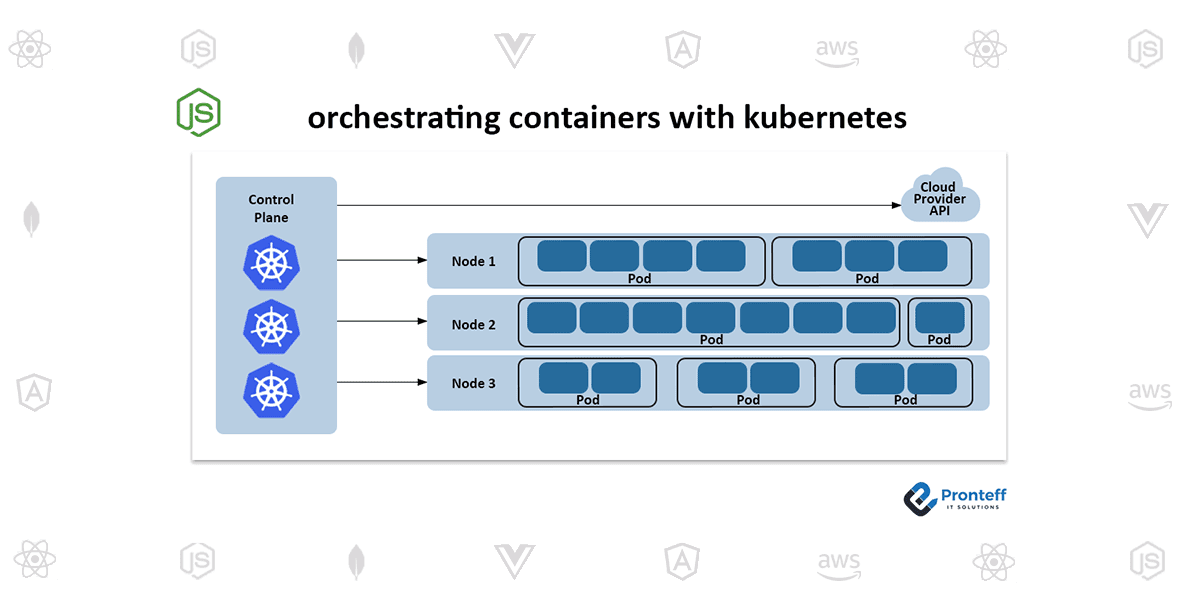
Figure 3: Container Orchestration with Kubernetes - Traffic Routing and Load Balancing
3.2 Production Deployment Manifest
Production Essentials Explained:
-
Resource Requests: Reserve specific CPU/memory guaranteeing baseline performance, preventing "noisy neighbor" resource contention
-
Resource Limits: Hard ceilings prevent any single service from starving others during traffic spikes
-
Readiness Probe: Routes traffic only to ready pods, not those still initializing (critical for Java Spring Boot)
-
Liveness Probe: Detects deadlocks and frozen containers, triggering automatic restarts
-
Rolling Strategy: Zero-downtime updates with maximum 1 surge pod, ensuring at least 2 replicas remain available
-
PreStop Hooks: Graceful shutdown allowing in-flight requests to complete before pod termination
Critical Production Configuration Pattern:
A critical production configuration pattern involves decoupling application settings from the codebase, ensuring that environment-specific variables and secrets are managed independently of the application logic. This practice enhances system stability and security by allowing operators to update configurations dynamically without requiring a full redeployment of the software.
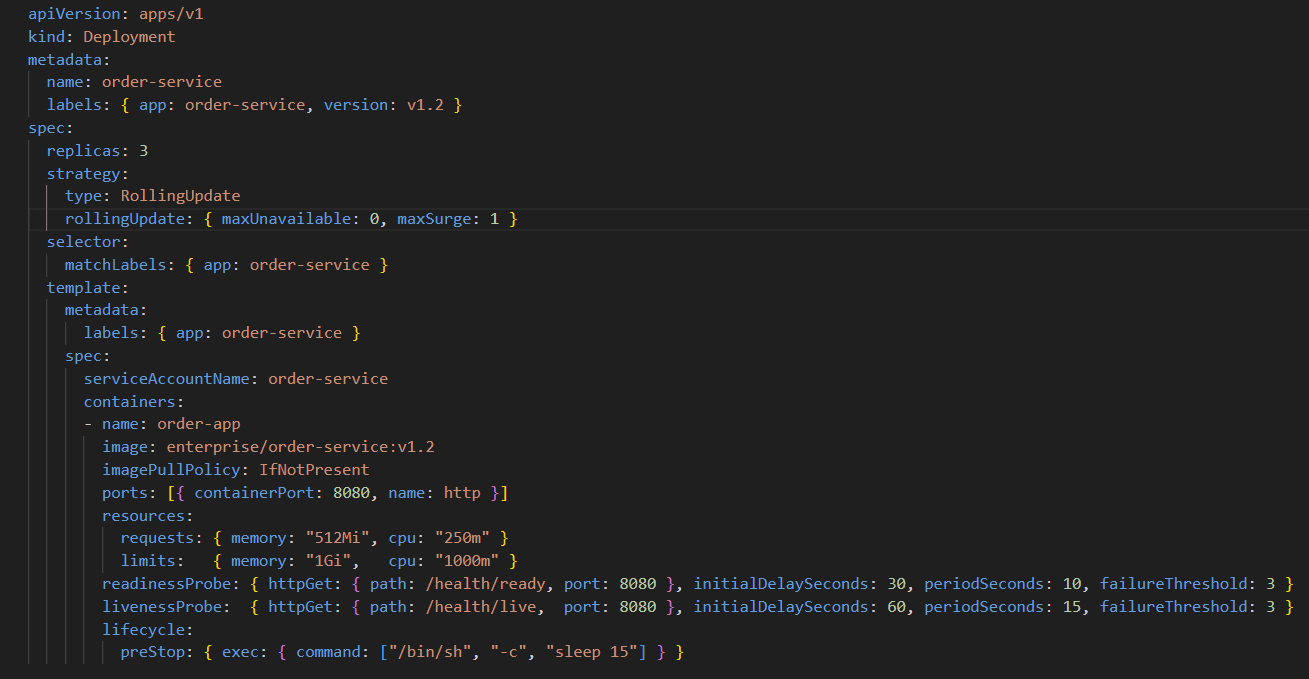
This above Kubernetes Deployment configuration defines a production-ready order-service with three replicas to ensure availability and fault tolerance. It uses a RollingUpdate strategy with maxUnavailable set to 0 and maxSurge set to 1, guaranteeing zero downtime during deployments.
The deployment consistently applies labels to manage pod selection and traffic routing. Each pod runs a versioned container image (v1.2) exposing port 8080, ensuring controlled and predictable releases.
CPU and memory requests and limits are explicitly defined to provide stable performance and prevent resource overuse in a shared cluster environment.
Readiness and liveness probes are configured to route traffic only to healthy pods and automatically recover from application failures. A preStop lifecycle hook enables graceful shutdown by allowing in-flight requests to complete before termination.
A dedicated service account is used to enforce secure access, making this configuration suitable for critical production workloads.
4. Horizontal Pod Autoscaling (HPA) and Elasticity
Horizontal Pod Autoscaling (HPA) grants your application true elasticity by automatically adding or removing pod replicas in response to real-time changes in demand, such as CPU spikes or traffic surges. This ensures your services maintain optimal performance during peak loads while minimizing resource waste and costs during quieter periods.
HPA Scaling Behavior in Production:
| Scenario | Response | Result | Cost Impact |
|---|---|---|---|
| Normal Operations (100 req/sec) | Maintains 2 replicas | Cost-efficient baseline | Minimal |
| Peak Traffic (5000 req/sec) | Scales to 20–30 replicas | CPU stays below 70% | Short-term increase |
| Post-Peak Cooldown (300s) | Gradual scale-down | Prevents thrashing | Reduced |
This elasticity reduces infrastructure costs by 40-60% through pay-as-you-go scaling, paying only for resources actually consumed[3].
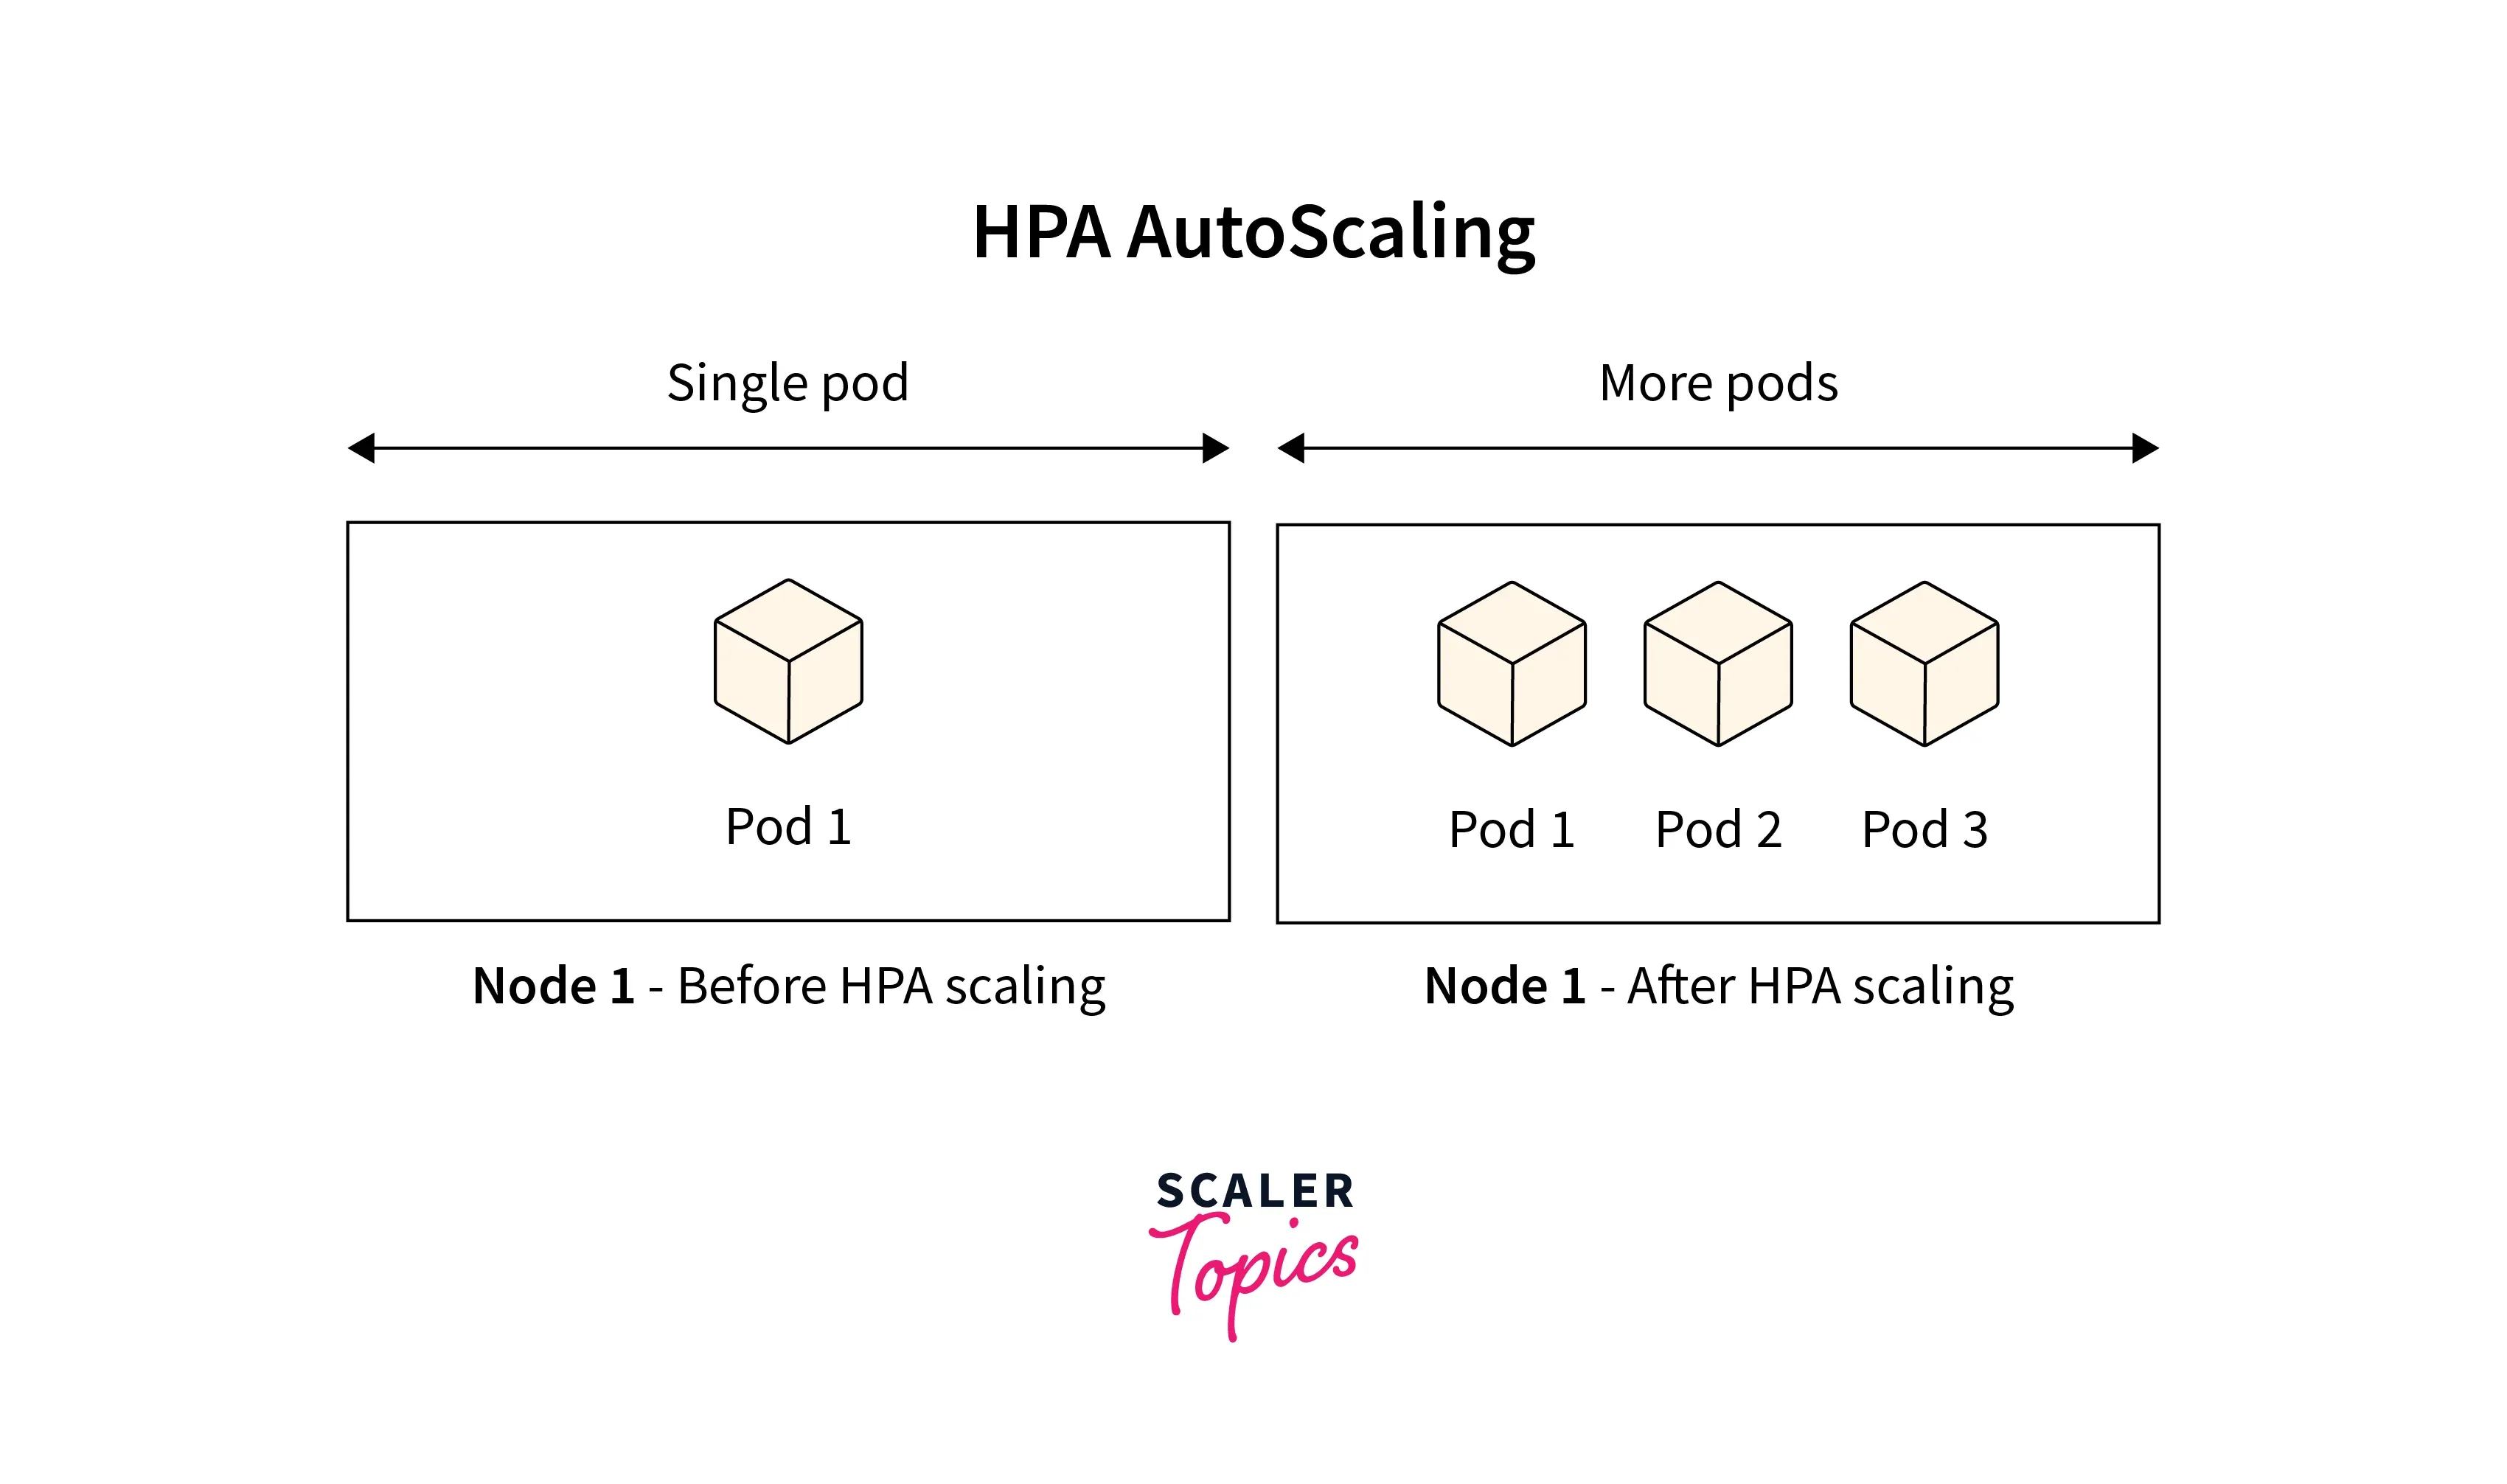
Figure 4: Horizontal Pod Autoscaling - Dynamic Scaling Based on Load and Metrics
HPA automatically adjusts replica counts based on CPU utilization or custom business metrics[3]:
Horizontal Pod Autoscaler (HPA) ensures high availability and cost efficiency by dynamically scaling the number of pod replicas up or down to match real-time traffic demands. It operates on a control loop that continuously monitors observed metrics—such as CPU usage or custom application events, against your defined target thresholds to automatically reconcile the state of the deployment.
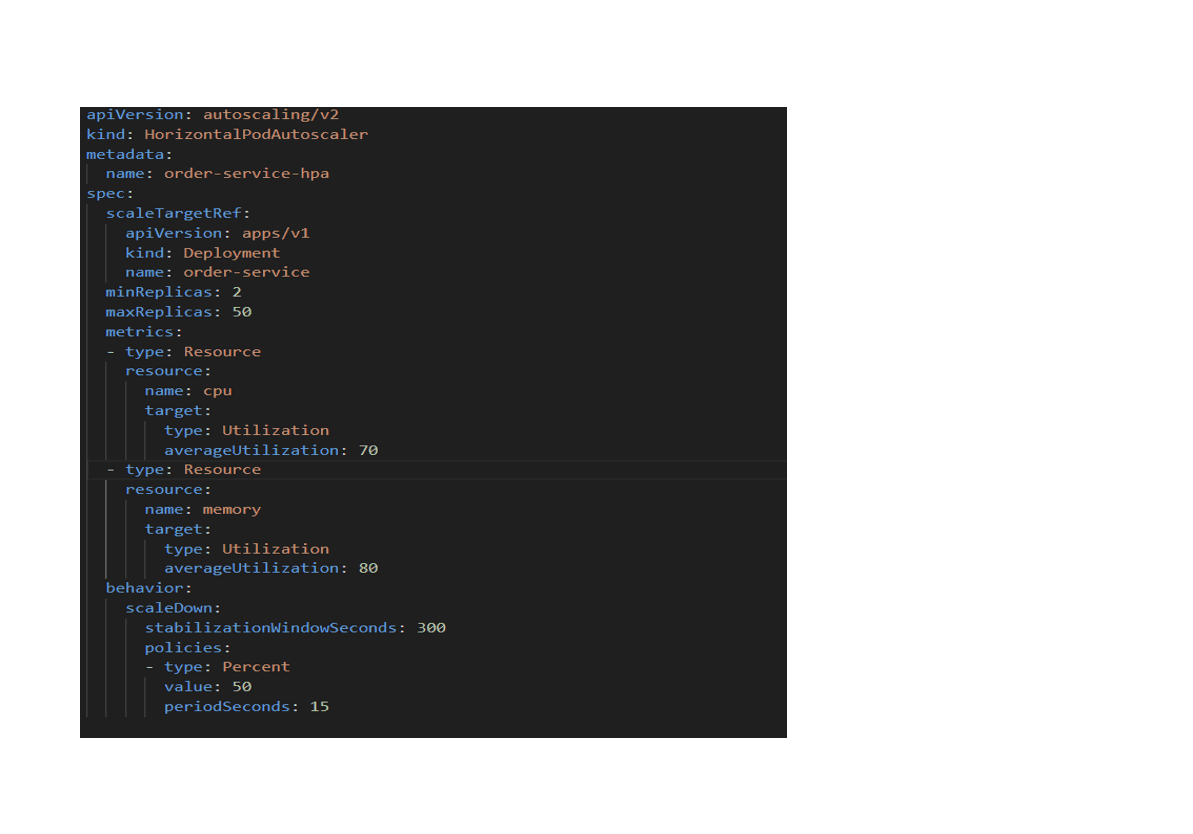
This configuration defines a HorizontalPodAutoscaler (HPA) for the order-service deployment using the autoscaling/v2 API. The HPA dynamically adjusts the number of pods based on runtime resource usage.
The autoscaler targets the order-service Deployment and maintains a minimum of 2 replicas and can scale up to 50 replicas to handle traffic spikes. Scaling decisions are driven by CPU and memory utilization—pods scale out when average CPU usage exceeds 70% or memory usage exceeds 80%.
Advanced scaling behavior is configured to ensure stability. A scale-down stabilization window of 300 seconds prevents premature downscaling during temporary traffic drops, while a rate-limiting policy restricts scale-down to 50% every 15 seconds, avoiding sudden capacity reduction.
Overall, this HPA setup ensures elastic scalability, cost efficiency, and stable performance for a production-critical service under varying workloads.
5. Advanced Deployment Patterns
Advanced deployment patterns leverage strategies like rolling updates and canary releases to decouple code deployment from feature release, ensuring zero-downtime operations. By integrating service mesh capabilities, these patterns provide granular traffic control and risk mitigation, allowing teams to safely test new versions in production before full rollout.
5.1 Zero-Downtime Rolling Updates
Rolling updates gradually replace pod replicas with new versions:
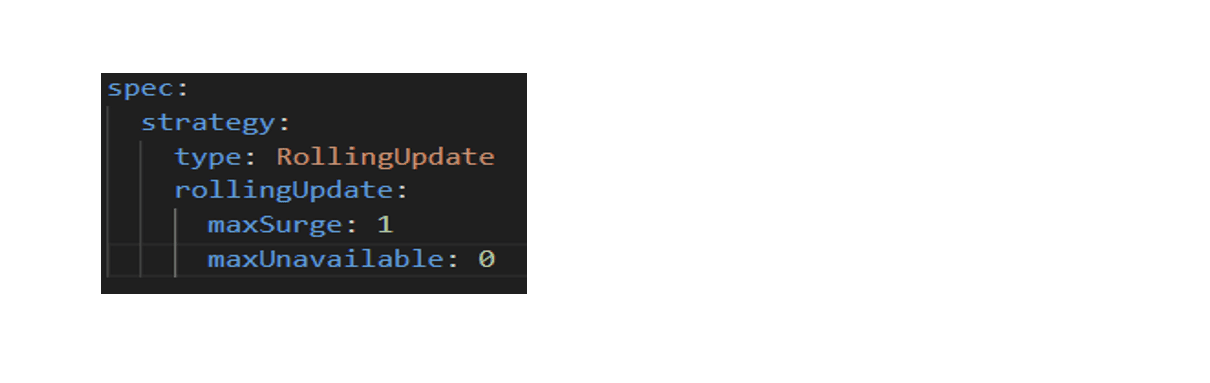
This configuration enables zero-downtime rolling updates for the application. The RollingUpdate strategy ensures that pods are updated gradually instead of all at once. Setting maxUnavailable to 0 guarantees that no existing pod is taken offline during an update, so the service always remains available. At the same time, maxSurge set to 1 allows Kubernetes to create one extra pod temporarily while updating, ensuring new instances are ready before old ones are terminated. This combination ensures continuous availability and safe deployments in production environments. [2].
5.2 Canary Deployments
Route small traffic percentages to new versions before full rollout. Using service mesh traffic splitting:
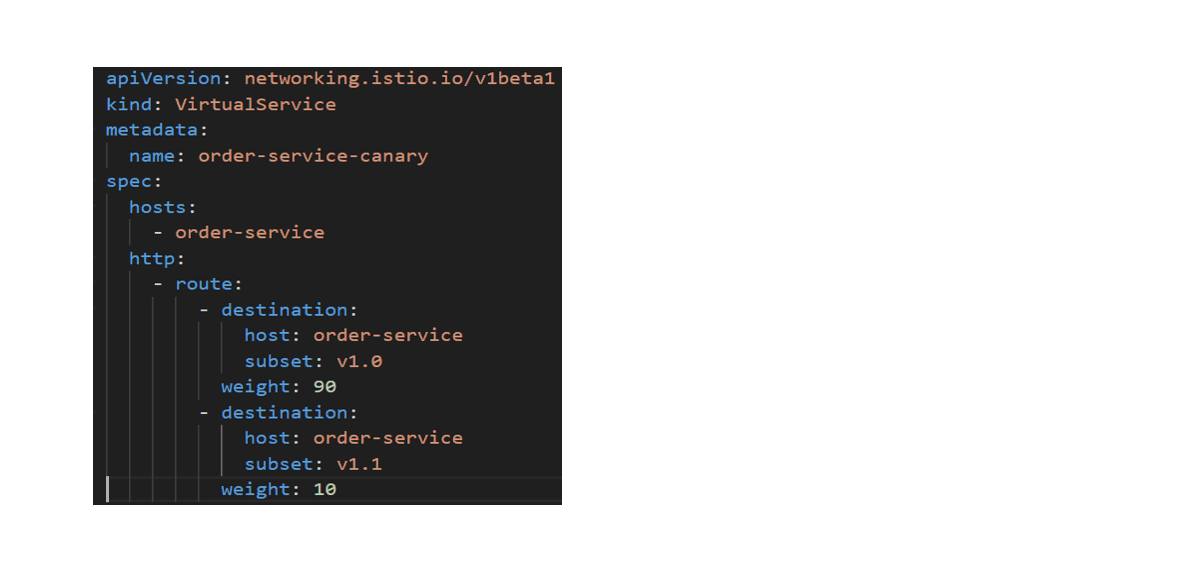
This configuration defines an Istio VirtualService to implement a canary deployment for the order-service. Incoming traffic to the service is split between two versions using weighted routing.
Here, 90% of the traffic is routed to the stable version (subset: v1.0), while 10% of the traffic is directed to the newer canary version (subset: v1.1). Both subsets point to the same service host but represent different application versions, typically defined using labels in a corresponding DestinationRule.
This approach allows the new version to be tested with a small portion of live traffic, enabling early detection of issues while minimizing risk. Traffic can be gradually shifted to the new version or rolled back instantly, making this a safe and controlled deployment strategy for production systems. [4].
5.3 Service Mesh Integration
Service meshes like Istio provide sophisticated cross-cutting concerns:
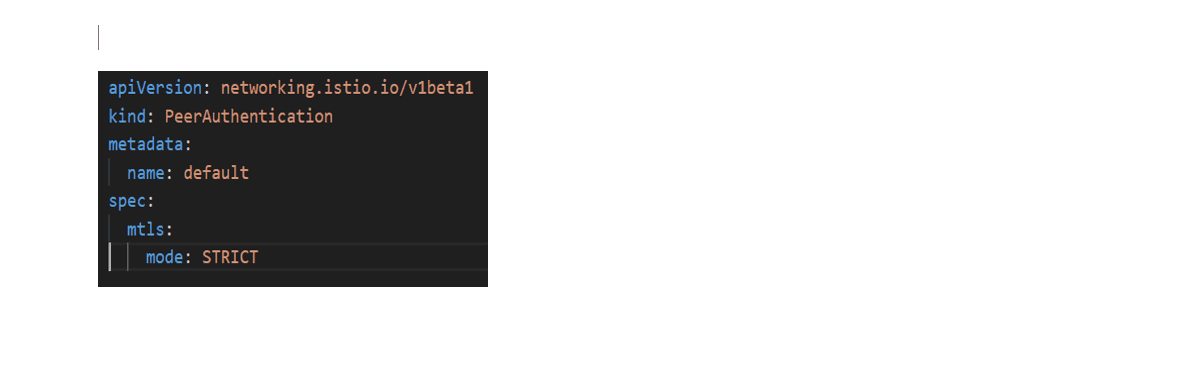
This configuration defines an Istio PeerAuthentication policy that enforces strict mutual TLS (mTLS) within the service mesh. By setting mode: STRICT, all service-to-service communication is required to use mTLS, meaning both the client and server must authenticate each other using certificates.
This ensures that only trusted workloads within the mesh can communicate, while all plaintext traffic is rejected. As a result, service communication is encrypted in transit, identities are verified at runtime, and the overall security posture of the production environment is significantly strengthened.
Service Mesh Benefits:
-
mTLS Encryption: Automatic encryption for all service-to-service communication
-
Intelligent Load Balancing: Advanced load balancing algorithms with retries and timeout policies
-
Circuit Breaking: Prevent cascade failures through automatic circuit breaking
-
Distributed Tracing: Automatic tracing and observability across service boundaries
-
Traffic Management: Fine-grained traffic control, mirroring, and routing policies
6. Reliability and Self-Healing
Kubernetes ensures high availability through a self-healing control loop that continuously monitors component health to detect and correct failures automatically. By utilizing Liveness and Readiness probes, the system instantly isolates unhealthy pods and restarts failed containers, ensuring that the desired state of the application is always maintained without manual intervention.
6.1 Health Checks and Probes
Kubernetes uses three distinct types of probes to automate the lifecycle management of our microservices. This "triad of health" ensures that traffic is only sent to healthy instances, and that broken instances are automatically replaced without human intervention.
-
Startup Probe: Handles applications requiring extended initialization (Java frameworks, .NET, large model loading)
-
Readiness Probe: Determines if pod can accept traffic (database connections established, caches warmed)
-
Liveness Probe: Detects deadlocks and frozen containers, triggering automatic restarts
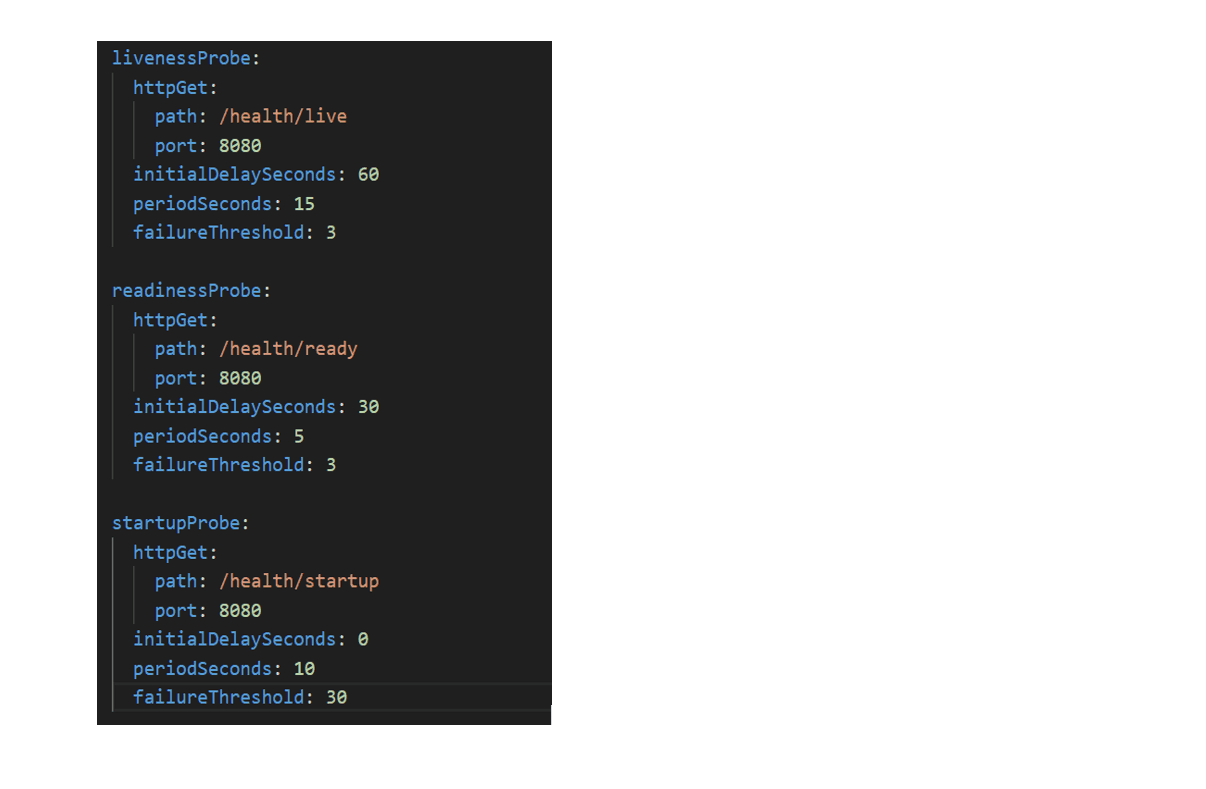
This configuration defines startup, readiness, and liveness probes to ensure reliable health management of the application in production.
The startup probe checks the /health/startup endpoint to determine when the application has fully started. Until this probe succeeds, Kubernetes does not apply liveness or readiness checks, preventing premature restarts for slow-starting services.
The readiness probe monitors the /health/ready endpoint to decide when the pod is ready to receive traffic. If this probe fails, the pod is temporarily removed from service discovery, ensuring traffic is only routed to healthy instances.
The liveness probe periodically checks the /health/live endpoint to detect application failures. If the probe fails repeatedly, Kubernetes restarts the container automatically to recover from unhealthy states.
Together, these probes enable self-healing, safe traffic routing, and stable operation, which are critical for production-grade Kubernetes workloads.
6.2 Pod Disruption Budgets
Production environments require protection against voluntary disruptions (node maintenance, cluster upgrades):
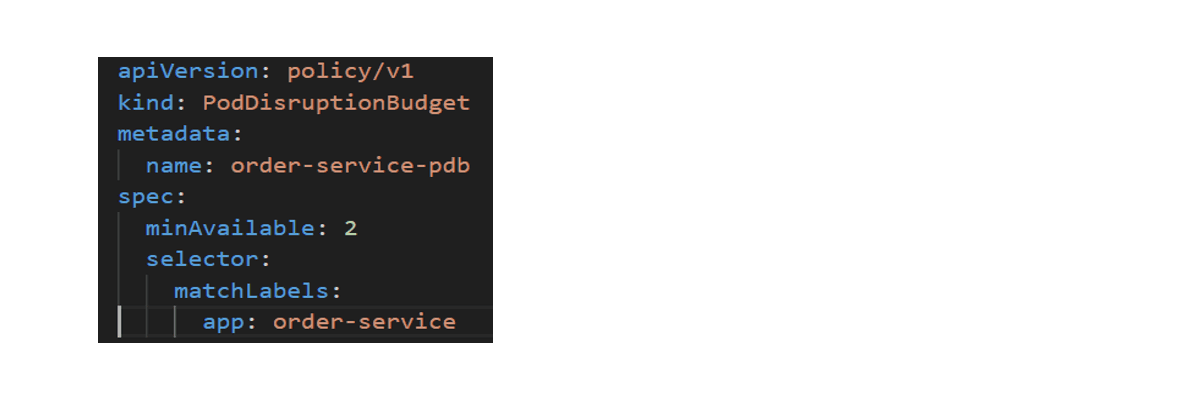
This configuration defines a PodDisruptionBudget (PDB) for the order-service to maintain availability during planned disruptions such as node maintenance or cluster upgrades.
By setting minAvailable: 2, Kubernetes ensures that at least two pods matching the order-service label remain running at all times. If an operation would reduce the number of available pods below this threshold, it is automatically blocked or delayed. This safeguard prevents excessive pod evictions and ensures the service continues to function reliably during voluntary disruptions, making it a critical component for production-grade, highly available deployments. [3].
7. Observability and Monitoring
Observability provides deep visibility into the cluster's state by correlating metrics, logs, and traces, enabling teams to diagnose complex distributed system issues effectively. By leveraging tools like Prometheus and Grafana, we establish a proactive monitoring posture that detects anomalies and performance bottlenecks before they impact the end-user experience.
7.1 Metrics Collection and Analysis
Kubernetes integrates seamlessly with Prometheus for comprehensive metrics collection. We categorize our monitoring strategy into four distinct layers to ensure no blind spots in production.
Key Metrics for Microservices:
| Metric Category | Key Metrics | Purpose |
|---|---|---|
| Pod Metrics | CPU, Memory, Network I/O | Resource efficiency tracking |
| Application Metrics | Request rate, latency P95/P99, error rate | Application health |
| Cluster Metrics | Node capacity, pod allocation ratio | Infrastructure planning |
| Business Metrics | Orders/sec, payment success rate | KPI monitoring |
Table 1: Critical Observability Metrics for Production
7.2 Distributed Tracing
Understanding request flows through multiple microservices requires distributed tracing. We utilize Jaeger to visualize the lifecycle of a request as it traverses different services.
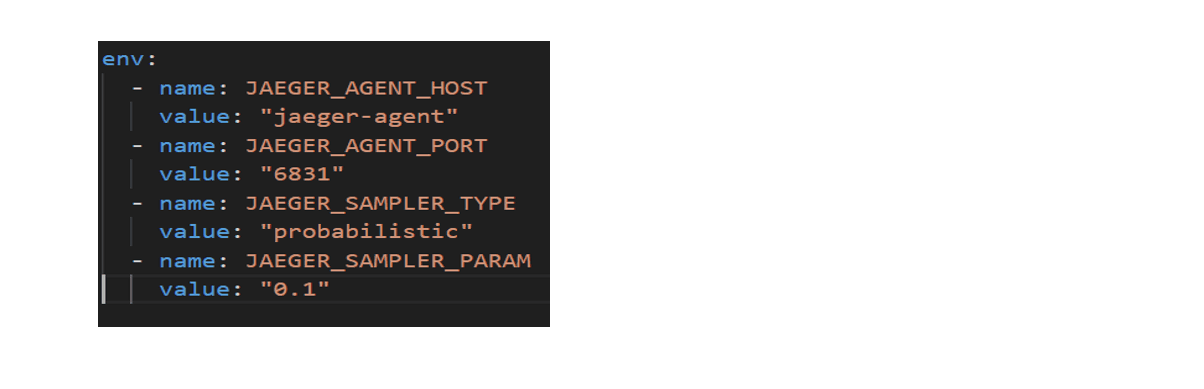
This configuration enables distributed tracing for the application using Jaeger. The environment variables specify the Jaeger agent host and port, allowing the service to send trace data to the Jaeger backend.
The sampler is configured as probabilistic, with a sampling rate of 0.1, meaning approximately 10% of requests are traced. This balances observability with performance by providing sufficient tracing data without introducing significant overhead.
Overall, this setup allows end-to-end request tracing across microservices, helping teams analyze latency, debug failures, and understand request flows in a distributed system. [2].
7.3 Centralized Logging
In a distributed system, logging into individual pods is inefficient. We implement centralized logging to aggregate logs from hundreds of pods into a single searchable interface.
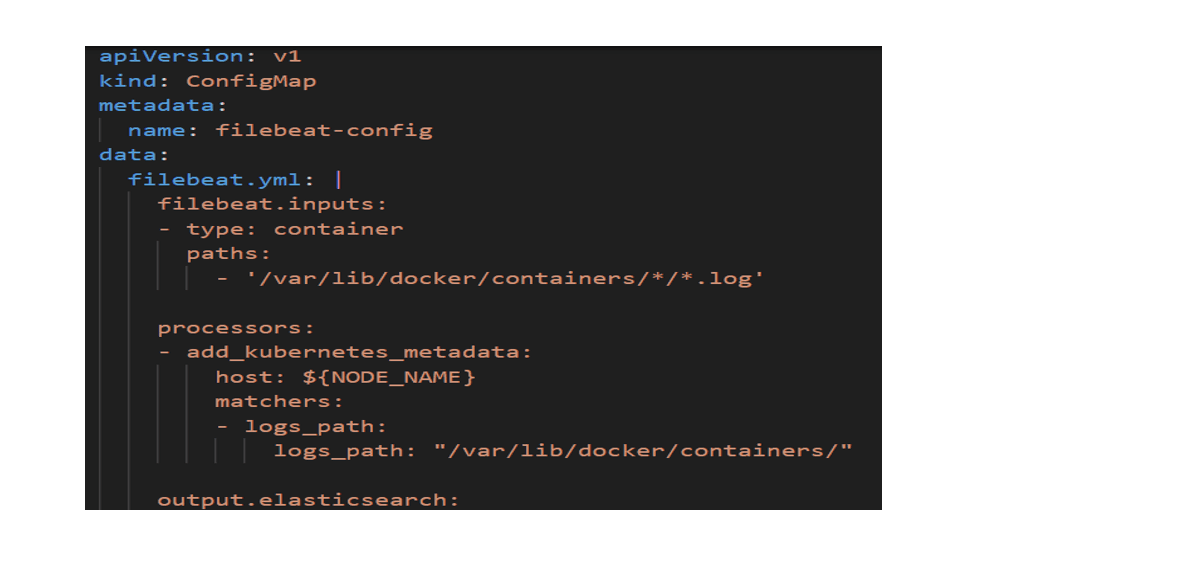
This configuration defines a ConfigMap for Filebeat to enable centralized logging in a Kubernetes environment. Filebeat is configured to collect container logs from the Docker log directory on each node and process them as container inputs.
The add_kubernetes_metadata processor enriches each log entry with Kubernetes context such as pod, namespace, and node information, making logs easier to search and correlate across services. The ${NODE_NAME} variable ensures logs are accurately mapped to the node where they originate.
Finally, the logs are forwarded to Elasticsearch, where they can be centrally stored, indexed, and visualized. This setup enables unified log aggregation, faster troubleshooting, and better observability across all microservices running in the cluster. [4].
8. Security Best Practices
Security in Kubernetes requires a layered "defense-in-depth" approach that moves beyond simple perimeter defense. We implement strict controls at the network, supply chain, and data layers to ensure a hardened production environment.
8.1 Network Policies and Zero Trust
We adopt a "Zero Trust" model where no service is trusted by default. Network Policies act as a distributed firewall inside the cluster, explicitly defining which pods can communicate with each other to restrict lateral movement.
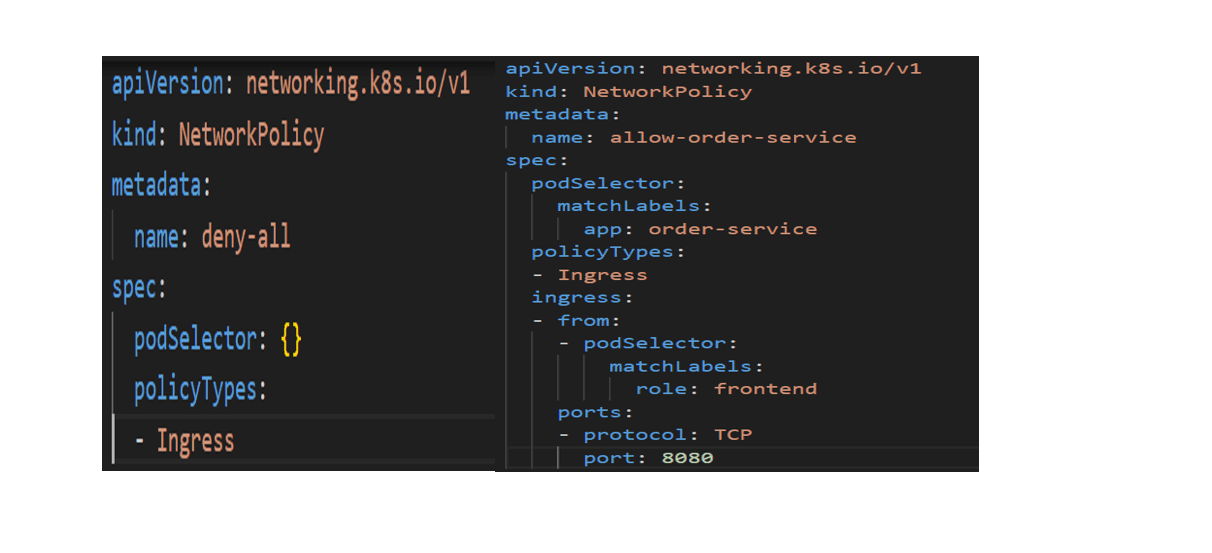
This configuration defines a Kubernetes NetworkPolicy that enforces a Zero Trust networking model for the order-service. The policy applies to pods labeled app: order-service and restricts inbound traffic by default.
Only pods with the label role: frontend are allowed to communicate with the order-service, and access is limited strictly to TCP port 8080. All other ingress traffic is implicitly denied.
By explicitly allowing only trusted sources and required ports, this policy reduces the attack surface, prevents unauthorized lateral movement within the cluster, and enforces strong service-level isolation—core principles of Zero Trust security in Kubernetes. [1].
8.2 Image Security and Scanning
Securing the software supply chain is critical to prevent malicious code from entering production. We use Admission Controllers to automatically reject any container image that has not passed vulnerability scanning.
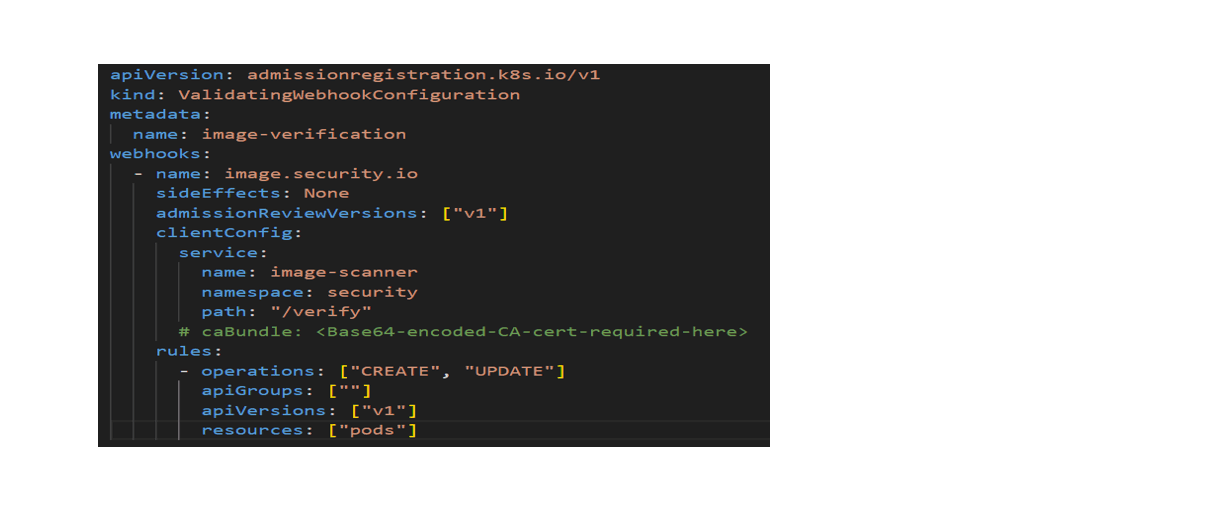
This configuration defines a ValidatingWebhookConfiguration to enforce container image security and scanning at admission time in Kubernetes.
The webhook intercepts pod CREATE and UPDATE requests and sends them to an external image verification service (image-scanner) before the pod is admitted into the cluster. The request is validated via the /verify endpoint, ensuring only approved and scanned images are allowed to run.
By integrating image scanning directly into the admission process, this setup prevents vulnerable or untrusted container images from being deployed, strengthening supply chain security and enforcing consistent security policies across the cluster. [2].
8.3 Secrets Management
Hardcoding credentials in code or configuration files is a major security risk. We utilize Kubernetes Secrets to decouple sensitive data from the application, ensuring encryption at rest and secure runtime injection.
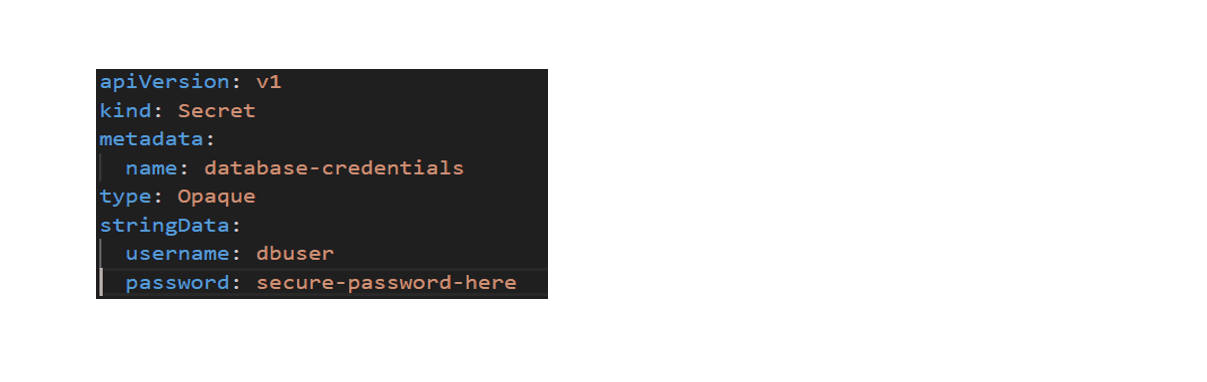
This configuration defines a Kubernetes Secret for secure credential management. The secret stores sensitive data such as the database username and password in an encoded, managed resource instead of hardcoding them in application manifests or images.
By using a Secret of type Opaque, credentials can be securely injected into pods as environment variables or mounted files at runtime. This approach reduces exposure of sensitive information, supports access control via RBAC, and enables safer secret rotation—making it a core practice for production-grade secret management in Kubernetes.
9. Cost Optimization Strategies
Effective cost optimization in Kubernetes leverages data-driven resource right-sizing and spot instances to drastically reduce infrastructure spend without compromising performance. By enforcing namespace quotas, organizations prevent resource waste and ensure predictable budget management across multi-tenant environments.
9.1 Resource Right-Sizing
Overprovisioning wastes millions annually; under provisioning risks outages:
Analysis Approach:
-
Monitor actual CPU/memory utilization over 30 days
-
Set requests at P95 utilization (covers 95% of observations)
-
Set limits at P99 utilization (cost control ceiling)
-
Adjust quarterly based on evolving patterns
9.2 Spot Instances and Bin-Packing
Cloud providers offer 50-70% discounts on spot instances for non-critical workloads:
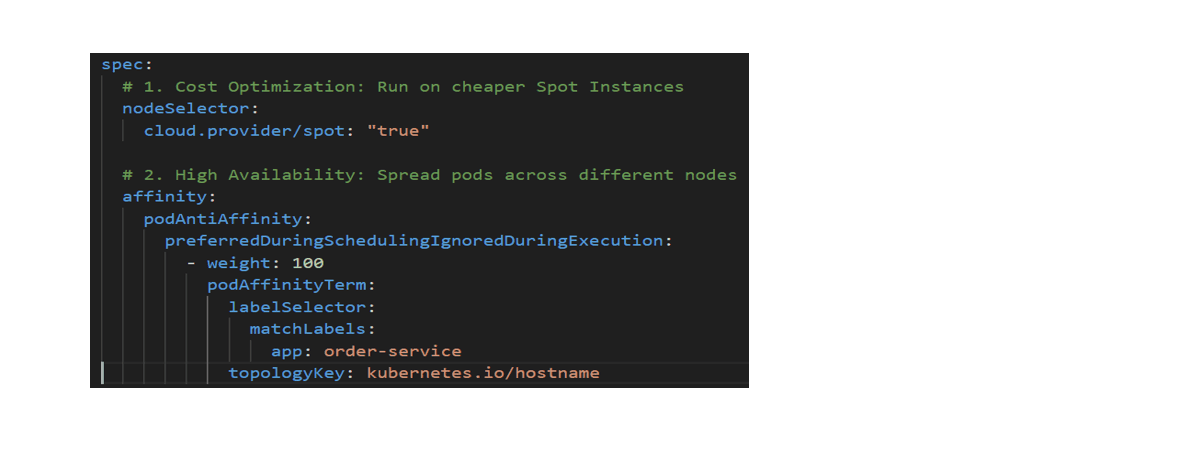
This configuration demonstrates cost optimization and high availability using spot instances and intelligent pod placement in Kubernetes.
The nodeSelector schedules pods only on nodes labeled as spot instances, allowing workloads to run on lower-cost compute resources and significantly reduce infrastructure costs.
The pod anti-affinity rule prefers spreading order-service pods across different nodes using the hostname topology key. This avoids placing multiple replicas on the same node, reducing the risk of service disruption due to single-node failures while still allowing efficient bin-packing across the cluster.
Together, this setup balances cost efficiency, fault tolerance, and resilient scheduling for production workloads.
9.3 Namespace Resource Quotas
Prevent teams from consuming unbounded resources:
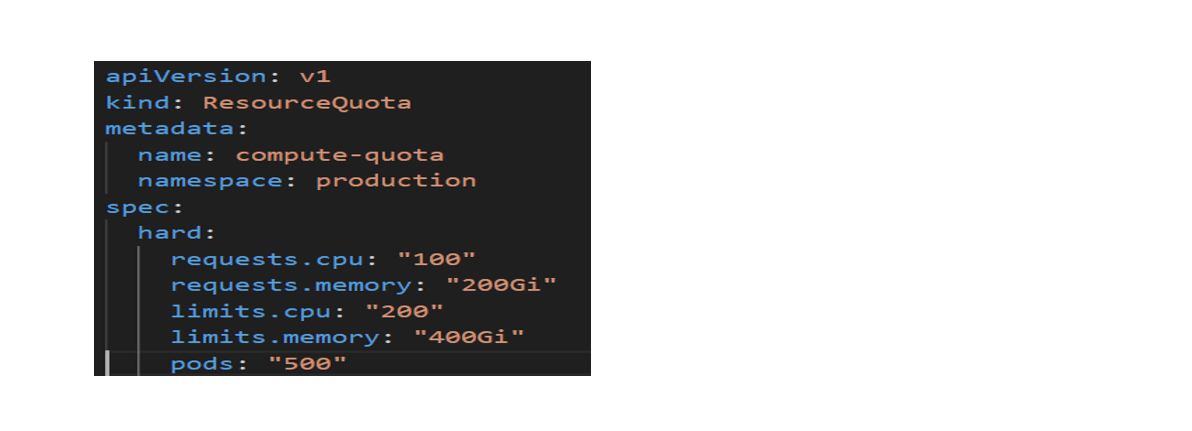
This configuration defines a ResourceQuota for the production namespace to control and limit resource consumption at the namespace level.
It sets upper bounds on total CPU and memory requests and limits, as well as the maximum number of pods that can be created. This prevents any single team or workload from exhausting shared cluster resources.
By enforcing namespace-level quotas, this setup ensures fair resource allocation, protects cluster stability, and supports predictable capacity planning in multi-tenant production environments.
10. Production Deployment Checklist
Before deploying microservices to production:
-
Health Checks: Startup, readiness, and liveness probes properly configured with appropriate timeouts
-
Resource Requests/Limits: Set based on workload analysis with P95/P99 utilization patterns
-
Graceful Shutdown: preStop hooks and terminationGracePeriodSeconds configured
-
Pod Disruption Budgets: Configured to protect against involuntary disruptions
-
Structured Logging: All services writing JSON structured logs to centralized aggregation system
-
Monitoring: Dashboards tracking golden signals with alerting on anomalies
-
Secrets Management: No hardcoded credentials; use Kubernetes Secrets with encryption
-
Network Policies: Implement least-privilege zero-trust network access controls
-
Image Scanning: Container images scanned for CVEs before deployment
-
Disaster Recovery: Regular backup and recovery testing with documented runbooks
-
Load Testing: Validate HPA scaling and system behavior under peak load
-
Change Management: Canary deployments and gradual rollouts for all production changes
11. Common Pitfalls and Solutions
Pitfall 1: Inadequate Resource Requests and Limits
-
Problem: Pods compete for resources, causing unpredictable performance and noisy neighbor effects
-
Solution: Profile applications under realistic production load; set requests based on P95 usage, limits at P99[2]
Pitfall 2: Ignoring Network Policies
-
Problem: Any pod communicates with any other, increasing blast radius of security breaches
-
Solution: Implement deny-all by default; explicitly allow required service-to-service communication[1]
Pitfall 3: Insufficient Replica Counts
-
Problem: Single pod failures cause complete service outages
-
Solution: Maintain minimum 2-3 production replicas; use Pod Disruption Budgets[3]
Pitfall 4: Missing Graceful Shutdown
-
Problem: In-flight requests dropped during deployments, causing transaction failures
-
Solution: Implement preStop hooks with appropriate sleep duration (15-30 seconds)[2]
Pitfall 5: Ignoring Cost Management
-
Problem: Rapidly escalating cloud bills from overprovisioned resources
-
Solution: Right-size resources quarterly; leverage Spot instances; implement Resource Quotas[3]
Pitfall 6: Inadequate Logging and Observability
-
Problem: Cannot debug issues in production distributed systems
-
Solution: Implement centralized structured logging with correlation IDs; distributed tracing; comprehensive metrics[4]
12. Conclusion
Kubernetes has fundamentally transformed how enterprises deploy and operate microservices at scale. By embracing Kubernetes' core capabilities—automated scaling, self-healing, rolling updates, and service discovery—organizations achieve unprecedented agility and reliability[1].
The path to successful microservice deployment requires more than technology adoption. It demands disciplined architecture, rigorous monitoring, and continuous optimization. Teams implementing patterns described in this article—proper health checks, accurate resource governance, security policies, and comprehensive observability—build systems that scale gracefully, fail safely, and evolve rapidly[2].
As cloud-native development continues maturing, Kubernetes' ecosystem expands with advanced capabilities like predictive autoscaling and AI-driven resource optimization. Organizations starting their Kubernetes journey should focus on foundational excellence: proper health checks, accurate resource requests, comprehensive observability, and robust security postures. These fundamentals form the bedrock enabling advanced capabilities tomorrow[3].
For senior engineers leading microservice transformation initiatives, the message is clear: Kubernetes is not just another deployment platform—it is the foundation upon which modern, scalable, resilient applications are built[1].
13. References
[1] Kubernetes Documentation. (2025). Kubernetes official documentation and API reference.
[2] Cloud Native Computing Foundation. (2024). Cloud Native Survey 2024. CNCF.
[3] Newman, S. (2015). Building Microservices: Designing Fine-Grained Systems. O'Reilly Media.

[4] Brown, A., & Soni, P. (2024). Microservices: Architecture, container, and challenges.
IEEE International Conference on Cloud Computing, 234-256.
https://doi.org/10.1109/CLOUD.2024
[5] Dragoni, L., Giallorenzo, S., Lafuente, A. L., Mazzara, M., Montesi, F., Mustafin, R., &
Safina, L. (2017). Microservices: yesterday, today, and tomorrow. Present and Ulterior
Software Engineering, 195-216. Springer.
About the Author

Mayank Namdev
Mayank is a Project Lead with deep Java roots, known for untangling complex specifications and delivering clean, executable software solutions.
About the Author
Mayank Namdev
Mayank is a Project Lead with deep Java roots, known for untangling complex specifications and delivering clean, executable software solutions.